Exercises for session 6

Exercise 6: Extension

In the presentation, we saw the following Stat extension paired with geom_segment().

library(ggplot2)

residual_lines <- function(data, formula = y ~ x, ...) {
  model <- lm(formula, data = data)
  data$fitted <- predict(model)
  data$residual <- residuals(model)
  data
}

StatResidual <- ggproto(
  "StatResidual", # class name
  Stat,           # parent
  compute_group = residual_lines,
  default_aes = aes(
    yend = after_stat(fitted)
  )
)

stat_residual <- make_constructor(StatResidual, geom = "segment")

p <- ggplot(mtcars, aes(disp, mpg)) +
  geom_smooth(
    method = "lm", 
    formula = y ~ x
  )

p + geom_point() +
  stat_residual()

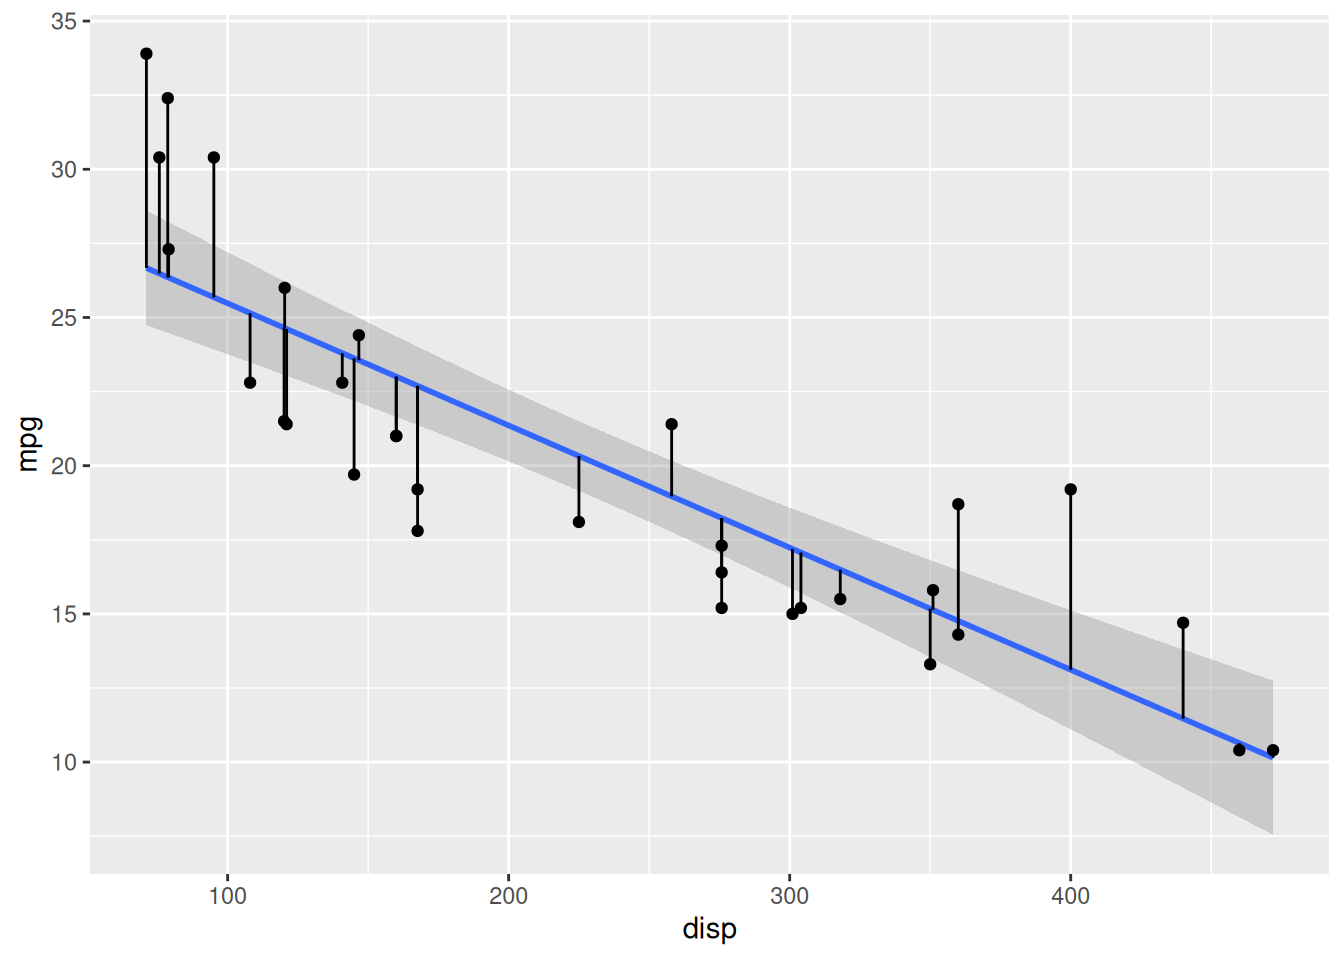
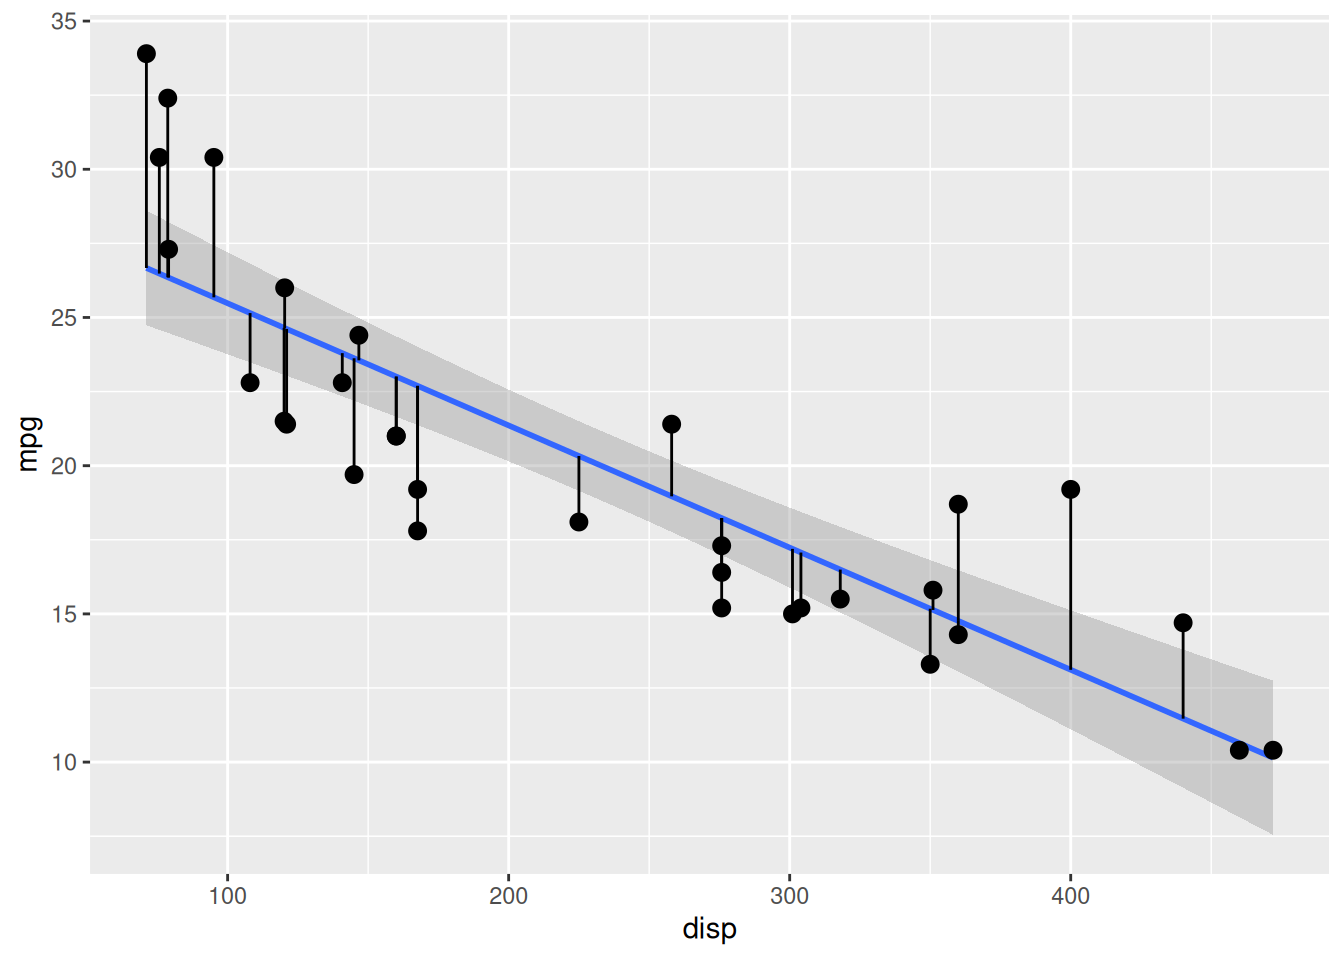
Instead of pairing with geom_segment() and combining the stat with geom_point(), we want to have a line and a point in a single layer. Repurpose the Stat class and constructor to work with geom_pointrange() instead.

You can use after_stat() to set ymin to the fitted computed variable and ymax to y.

StatResidual <- ggproto(
  "StatResidual", # class name
  Stat,           # parent
  compute_group = residual_lines,
  default_aes = aes(
    ymin = after_stat(fitted),
    ymax = after_stat(y)
  )
)

stat_residual <- make_constructor(StatResidual, geom = "pointrange")

p + stat_residual()