Presentations with reveal.js

File formats

Quarto supports a variety of formats for creating presentations, including:

  • revealjs
  • pptx
  • beamer

brand.yml is currently supported only in revealjs.

reveal.js

reveal.js presentations allow you to create stunning presentations on the web.

  • Present code and LaTeX equations
  • Include computations in slide output
  • Add image, video, and iFrame backgrounds
  • Add fancy transitions and animations
  • Activate scroll view

…and much more

reveal.js basics

  • reveal.js basics

  • Building slides

  • Presenting slides

  • Branding slides

Converting to reveal.js

Convert your document to a reveal.js presentation by editing format in the YAML heading:

format: revealjs

Example

---
title: "Habits"
author: "John Doe"
format: html
---

## Getting up

- Turn off alarm
- Get out of bed

## Going to sleep

- Get in bed
- Count sheep

Example

---
title: "Habits"
author: "John Doe"
format: revealjs
---

## Getting up

- Turn off alarm
- Get out of bed

## Going to sleep

- Get in bed
- Count sheep

Example with sections

---
title: "Habits"
author: "John Doe"
format: revealjs
---

# In the morning

## Getting up

- Turn off alarm
- Get out of bed

## Breakfast

- Eat eggs
- Drink coffee

# In the evening

## Dinner

- Eat spaghetti
- Drink wine

## Going to sleep

- Get in bed
- Count sheep

Example with sections

---
title: "Habits"
author: "John Doe"
format: revealjs
---

- Turn off alarm
- Get out of bed

---

- Get in bed
- Count sheep

Your turn

  • In your document’s YAML header, change format: html to format: revealjs.
  • Use first-level headings (#) to create a new slide. Use other Markdown headings and text for content on each slide.
  • Save and render your document.

Quarto will create an HTML file that is a fully functional slide deck.

Note

You can remove code-fold and code-summary from the YAML header, as these are for HTML documents and do not apply to presentations.

05:00

Building slides

  • reveal.js basics

  • Building slides

  • Presenting slides

  • Branding slides

Editing slides

The quarto-revealjs-editable extension allows for the repositioning and resizing of images and text divs directly in previewed slides.

Content overflow

Use the .smaller class to use a smaller typeface so that more text fits on the slide. For example:

## Slide Title {.smaller}

Use the .scrollable class to make off-slide content available by scrolling. For example:

## Slide Title {.scrollable}


Lorem ipsum dolor sit amet, consectetur adipiscing elit.
Nullam sagittis ex eget bibendum vulputate.

Vestibulum lobortis mauris sed lorem auctor, in commodo ex semper.
Vestibulum congue nisl eget blandit suscipit.
Curabitur sit amet diam elementum, dictum massa quis, vulputate est.
Sed dignissim lacus et lorem pellentesque interdum.
Ut efficitur eros id leo condimentum, vel sodales velit lacinia.

Vivamus cursus massa accumsan tellus imperdiet aliquet id et odio.
Duis tincidunt nunc vitae erat sollicitudin, non condimentum enim eleifend.
Phasellus ac ligula aliquam, aliquet nunc quis, tempor libero.
Vivamus ultricies enim a metus ultrices, a pretium velit tristique.

Slide transitions

Edit the YAML to change the slide transitions:

---
title: "Presentation"
format:
  revealjs:
    transition: slide
    transition-speed: fast
---

Slide transitions

The next few slides will transition using the slide transition

Transition Description
none No transition (default, switch instantly)
fade Cross fade
slide Slide horizontally
convex Slide at a convex angle
concave Slide at a concave angle
zoom Scale the incoming slide so it grows in from the center of the screen.

Tabsets

mpg cyl disp hp drat wt qsec vs am gear carb
Mazda RX4 21.0 6 160.0 110 3.90 2.620 16.46 0 1 4 4
Mazda RX4 Wag 21.0 6 160.0 110 3.90 2.875 17.02 0 1 4 4
Datsun 710 22.8 4 108.0 93 3.85 2.320 18.61 1 1 4 1
Hornet 4 Drive 21.4 6 258.0 110 3.08 3.215 19.44 1 0 3 1
Hornet Sportabout 18.7 8 360.0 175 3.15 3.440 17.02 0 0 3 2
Valiant 18.1 6 225.0 105 2.76 3.460 20.22 1 0 3 1
Duster 360 14.3 8 360.0 245 3.21 3.570 15.84 0 0 3 4
Merc 240D 24.4 4 146.7 62 3.69 3.190 20.00 1 0 4 2
Merc 230 22.8 4 140.8 95 3.92 3.150 22.90 1 0 4 2
Merc 280 19.2 6 167.6 123 3.92 3.440 18.30 1 0 4 4
Merc 280C 17.8 6 167.6 123 3.92 3.440 18.90 1 0 4 4
Merc 450SE 16.4 8 275.8 180 3.07 4.070 17.40 0 0 3 3
Merc 450SL 17.3 8 275.8 180 3.07 3.730 17.60 0 0 3 3
Merc 450SLC 15.2 8 275.8 180 3.07 3.780 18.00 0 0 3 3
Cadillac Fleetwood 10.4 8 472.0 205 2.93 5.250 17.98 0 0 3 4
Lincoln Continental 10.4 8 460.0 215 3.00 5.424 17.82 0 0 3 4
Chrysler Imperial 14.7 8 440.0 230 3.23 5.345 17.42 0 0 3 4
Fiat 128 32.4 4 78.7 66 4.08 2.200 19.47 1 1 4 1
Honda Civic 30.4 4 75.7 52 4.93 1.615 18.52 1 1 4 2
Toyota Corolla 33.9 4 71.1 65 4.22 1.835 19.90 1 1 4 1
Toyota Corona 21.5 4 120.1 97 3.70 2.465 20.01 1 0 3 1
Dodge Challenger 15.5 8 318.0 150 2.76 3.520 16.87 0 0 3 2
AMC Javelin 15.2 8 304.0 150 3.15 3.435 17.30 0 0 3 2
Camaro Z28 13.3 8 350.0 245 3.73 3.840 15.41 0 0 3 4
Pontiac Firebird 19.2 8 400.0 175 3.08 3.845 17.05 0 0 3 2
Fiat X1-9 27.3 4 79.0 66 4.08 1.935 18.90 1 1 4 1
Porsche 914-2 26.0 4 120.3 91 4.43 2.140 16.70 0 1 5 2
Lotus Europa 30.4 4 95.1 113 3.77 1.513 16.90 1 1 5 2
Ford Pantera L 15.8 8 351.0 264 4.22 3.170 14.50 0 1 5 4
Ferrari Dino 19.7 6 145.0 175 3.62 2.770 15.50 0 1 5 6
Maserati Bora 15.0 8 301.0 335 3.54 3.570 14.60 0 1 5 8
Volvo 142E 21.4 4 121.0 109 4.11 2.780 18.60 1 1 4 2
::: panel-tabset
### Plot

```{r}
library(ggplot2)
ggplot(mtcars, aes(hp, mpg, color = am)) +
  geom_point() +
  geom_smooth(formula = y ~ x, method = "loess")
```

### Data

```{r}
knitr::kable(mtcars)
```
:::

Column layout

Arrange content into columns of varying widths:

Motor Trend Car Road Tests

The data was extracted from the 1974 Motor Trend US magazine, and comprises fuel consumption and 10 aspects of automobile design and performance for 32 automobiles.

mpg cyl disp hp wt
Mazda RX4 21.0 6 160 110 2.620
Mazda RX4 Wag 21.0 6 160 110 2.875
Datsun 710 22.8 4 108 93 2.320
Hornet 4 Drive 21.4 6 258 110 3.215
Hornet Sportabout 18.7 8 360 175 3.440
Valiant 18.1 6 225 105 3.460

Column layout

Arrange content into columns of varying widths:

::: columns
::: {.column width="35%"}
#### Motor Trend Car Road Tests

The data was extracted from the 1974 Motor Trend US magazine, and comprises fuel consumption and 10 aspects of automobile design and performance for 32 automobiles.
:::

::: {.column width="3%"}
:::

::: {.column width="62%"}
```{r}
knitr::kable(head(mtcars)[,c("mpg", "cyl", "disp", "hp", "wt")])
```
:::
:::

Line highlighting

  • Highlight specific lines for emphasis
  • Incrementally highlight additional lines
``` {.python code-line-numbers="4-5|7|10"}
```
import numpy as np
import matplotlib.pyplot as plt

r = np.arange(0, 2, 0.01)
theta = 2 * np.pi * r
fig, ax = plt.subplots(subplot_kw={'projection': 'polar'})
ax.plot(theta, r)
ax.set_rticks([0.5, 1, 1.5, 2])
ax.grid(True)
plt.show()

Executable code

library(ggplot2)
ggplot(mtcars, aes(hp, mpg, color = am)) +
  geom_point() +
  geom_smooth(formula = y ~ x, method = "loess")

LaTeX equations

MathJax rendering of equations to HTML

\begin{gather*}
a_1=b_1+c_1\\
a_2=b_2+c_2-d_2+e_2
\end{gather*}

\begin{align}
a_{11}& =b_{11}&
  a_{12}& =b_{12}\\
a_{21}& =b_{21}&
  a_{22}& =b_{22}+c_{22}
\end{align}
\[\begin{gather*} a_1=b_1+c_1\\ a_2=b_2+c_2-d_2+e_2 \end{gather*}\] \[\begin{align} a_{11}& =b_{11}& a_{12}& =b_{12}\\ a_{21}& =b_{21}& a_{22}& =b_{22}+c_{22} \end{align}\]

Incremental lists

Lists can optionally be displayed incrementally:

  • First item
  • Second item
  • Third item


Insert pauses to make other types of content display incrementally.

Incremental lists

Lists can optionally be displayed incrementally:

::: incremental
-   First item
-   Second item
-   Third item
:::

. . .

<br/> Insert pauses to make other types of content display incrementally.

Fragments

Incremental text display and animation with fragments:


Fade in

Slide up while fading in

Slide left while fading in

Fade in then semi out

Strike

Highlight red

Fragments

::: {.fragment .fade-in}
Fade in
:::

::: {.fragment .fade-up}
Slide up while fading in
:::

::: {.fragment .fade-left}
Slide left while fading in
:::

::: {.fragment .fade-in-then-semi-out}
Fade in then semi out
:::

. . .

::: {.fragment .strike}
Strike
:::

::: {.fragment .highlight-red}
Highlight red
:::

Absolute position

Position images or other elements at precise locations

Absolute position

![](images/kitten-400-350.jpeg){.absolute top="170" left="30" width="400" height="400"}

![](images/kitten-450-250.jpeg){.absolute .fragment top="150" right="80" width="450"}

![](images/kitten-300-200.jpeg){.absolute .fragment bottom="110" right="130" width="300"}

Interactive slides

Include Jupyter widgets and htmlwidgets in your presentations

```{r}
#| fig-height: 5
library(leaflet)
leaflet() %>%
  addTiles() %>%  # Add default OpenStreetMap map tiles
  addMarkers(lng=174.768, lat=-36.852, popup="The birthplace of R")
```

Interactive slides

Add executable R or Python chunks into your slides:

Interactive slides

Add Shinylive applications into your slides:

#| '!! shinylive warning !!': |
#|   shinylive does not work in self-contained HTML documents.
#|   Please set `embed-resources: false` in your metadata.
#| standalone: true
#| viewerHeight: 500

library(shiny)
library(bslib)

# Define UI for app that draws a histogram ----
ui <- page_sidebar(
  sidebar = sidebar(open = "open",
    numericInput("n", "Sample count", 100),
    checkboxInput("pause", "Pause", FALSE),
  ),
  plotOutput("plot", width=1100)
)

server <- function(input, output, session) {
  data <- reactive({
    input$resample
    if (!isTRUE(input$pause)) {
      invalidateLater(1000)
    }
    rnorm(input$n)
  })
  
  output$plot <- renderPlot({
    hist(data(),
      breaks = 40,
      xlim = c(-2, 2),
      ylim = c(0, 1),
      lty = "blank",
      xlab = "value",
      freq = FALSE,
      main = ""
    )
    
    x <- seq(from = -2, to = 2, length.out = 500)
    y <- dnorm(x)
    lines(x, y, lwd=1.5)
    
    lwd <- 5
    abline(v=0, col="red", lwd=lwd, lty=2)
    abline(v=mean(data()), col="blue", lwd=lwd, lty=1)

    legend(legend = c("Normal", "Mean", "Sample mean"),
      col = c("black", "red", "blue"),
      lty = c(1, 2, 1),
      lwd = c(1, lwd, lwd),
      x = 1,
      y = 0.9
    )
  }, res=140)
}

# Create Shiny app ----
shinyApp(ui = ui, server = server)

Your turn

  • Add {.smaller} to your heading to decrease its font size, like this: ## Global Happiness Trends {.smaller}.
  • Place your plot and table side-by-side. Adjust the percentages as needed.
  • Use ::: panel-tabset on the “Country-Level Analysis” slide to organize your content.
  • To improve the flow, add slide-transition: slide to your YAML header. Other options include fade, convex, concave, or zoom.
05:00

Presenting slides

  • reveal.js basics

  • Building slides

  • Presenting slides

  • Branding slides

Easy navigation

Quickly jump to other parts of your presentation

Toggle the slide menu with the menu button (bottom left of slide) to go to other slides and access presentation tools.

You can also press m to toggle the menu open and closed.

Jump to slide

You can also press g to toggle ‘Jump To Slide’ modal box to quickly go to one of your slide using its number or id.

Chalkboard

Enable by adding:

format:
  revealjs:
    chalkboard: true


Use the chalkboard button at the bottom left of the slide to toggle the chalkboard.

Use the notes canvas button at the bottom left of the slide to toggle drawing on top of the current slide.

You can also press b to toggle the chalkboard or c to toggle the notes canvas.

Point of view

press o to toggle overview mode:

Hold down the Alt/Option and click on any element to zoom towards it—try it now on this slide.

Speaker view

press s (or use the tools in presentation menu ) to open speaker view
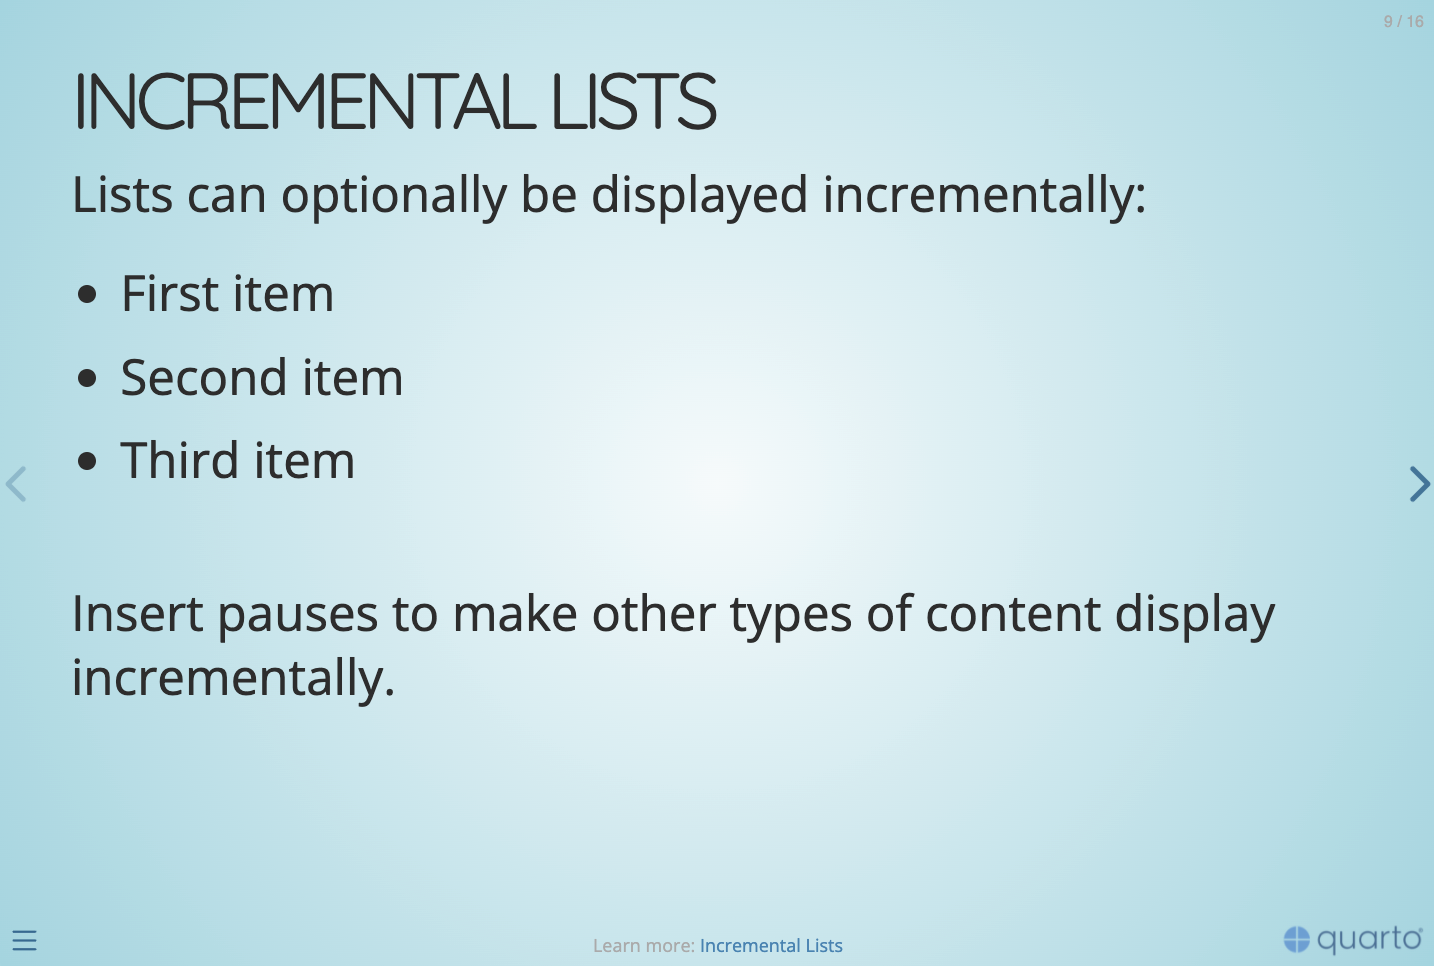
## Slide with speaker notes

Slide content

::: {.notes}
Speaker notes go here.
:::

Branding slides

  • reveal.js basics

  • Building slides

  • Presenting slides

  • Branding slides

Themes

10 built-in themes also apply to reveal.js:

reveal.js with brand.yml

The _brand.yml file in the root directory of your project will automatically apply the brand to your revealjs documents.

Title slide background

Add a custom background to the title slide using the title-slide-attributes key:

---
format: revealjs
title-slide-attributes:
    data-background-image: images/milky-way.jpeg
    data-background-size: cover
---

Slide backgrounds

Set the background attribute on a slide to change the background color (all CSS color formats are supported).

Use {{< brand color COLOR_NAME BRAND_MODE >}} to return the brand color named COLOR_NAME as a string.

---
format: revealjs
---

## Slide Title {background-color='{{< brand color primary >}}'}

Media backgrounds

You can also use the following as a slide background:

  • An image: background-image

  • A video: background-video

  • An iframe: background-iframe

And more…

  • Touch optimized (presentations look great on mobile, swipe to navigate slides)
  • Footer & Logo (optionally specify custom footer per-slide or hide global footer)
  • Auto-Slide (step through slides automatically, without any user input)
  • Multiplex (allows your audience to follow the slides of the presentation you are controlling on their own phone, tablet or laptop).

Your turn

  • Change the title slide background.
    • Find an image on Unsplash and get the direct URL to the image file.
    • Add title-slide-attributes to your YAML header and specify the data-background-image attribute with the image’s URL.
    • If it’s a dark photo, you may want to change data-background-color to a dark color so that the slide uses a light font color.
  • Edit Conclusion slide background color: Use the brand.yml shortcodes to change the color to primary.
10:00