from palmerpenguins import load_penguins
from plotnine import aes, geom_histogram, ggplot, theme_minimal
dat = load_penguins()
dat.head()
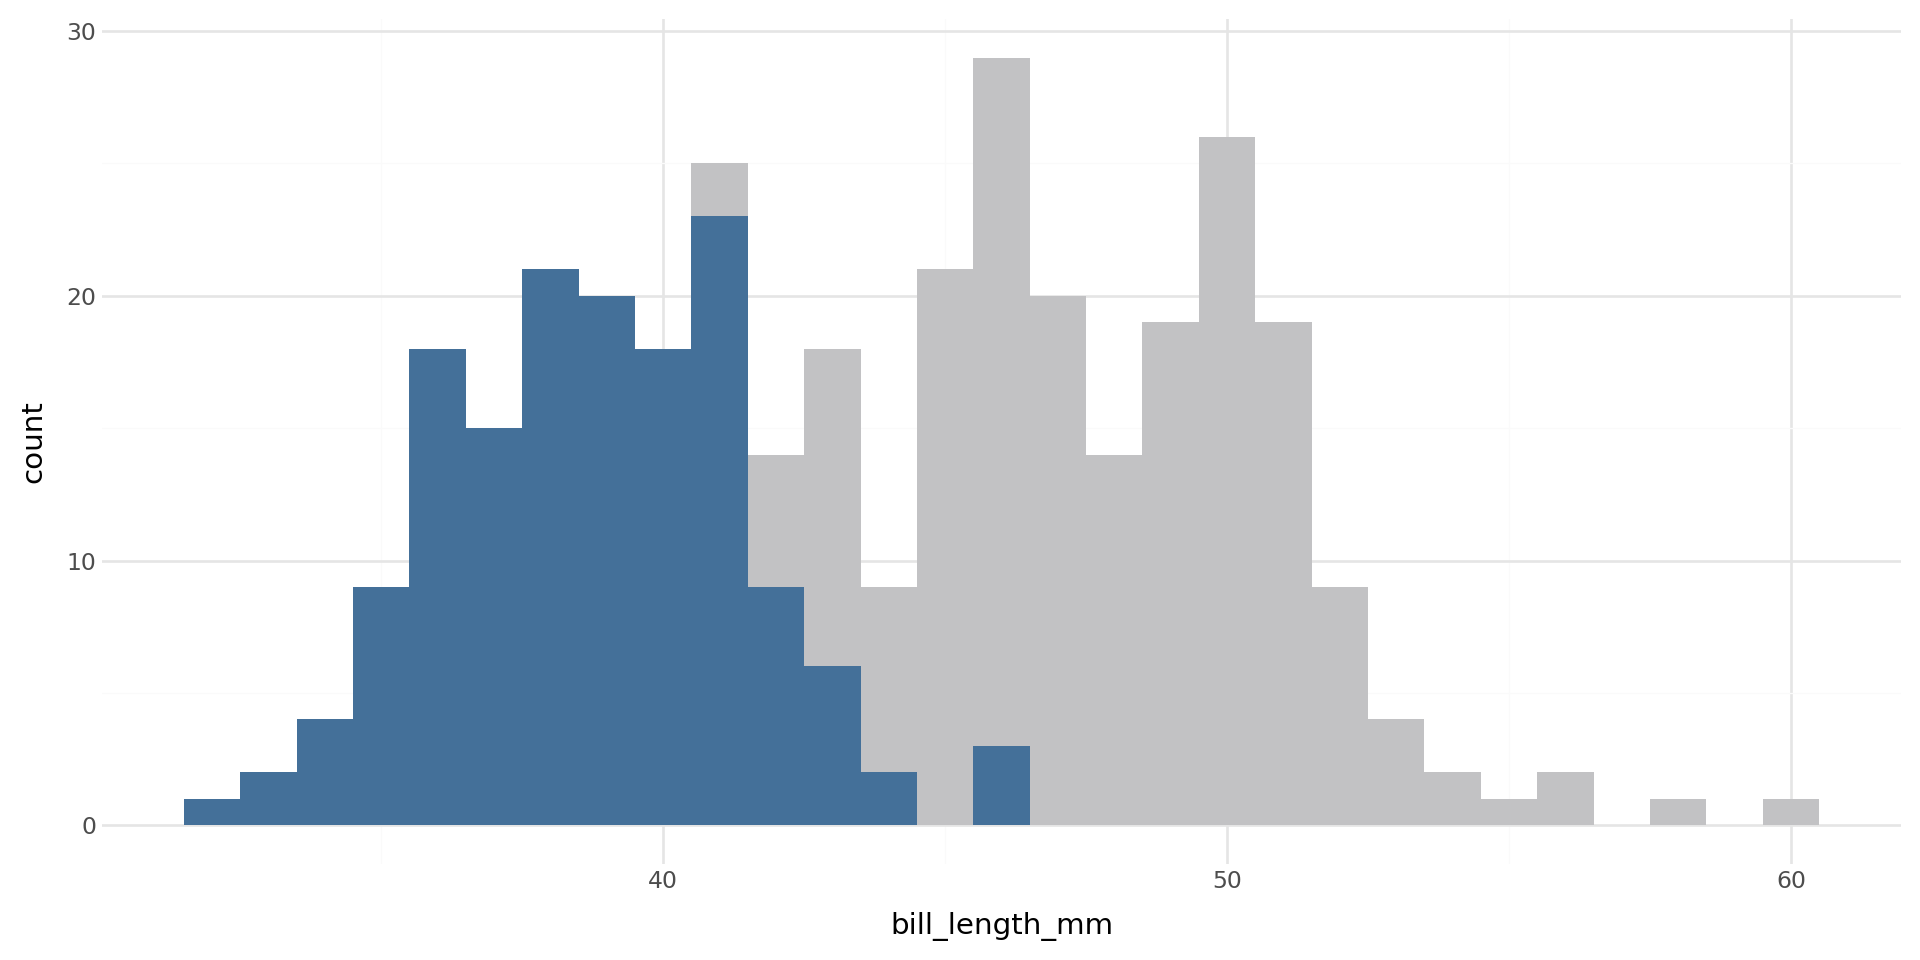
species = "Adelie" # selected species
sel = dat.loc[dat.species == species] # selected data
(
ggplot(aes(x="bill_length_mm"))
+ geom_histogram(dat, fill="#C2C2C4", binwidth=1)
+ geom_histogram(sel, fill="#447099", binwidth=1)
+ theme_minimal()
)Your first application
Plan out your application data
- Start off with the data you have an some kind of data artifact without the interactivity
- Use a placeholder variable to apply the interactivity manually
Visualizing penguin data
Visualizing penguin data
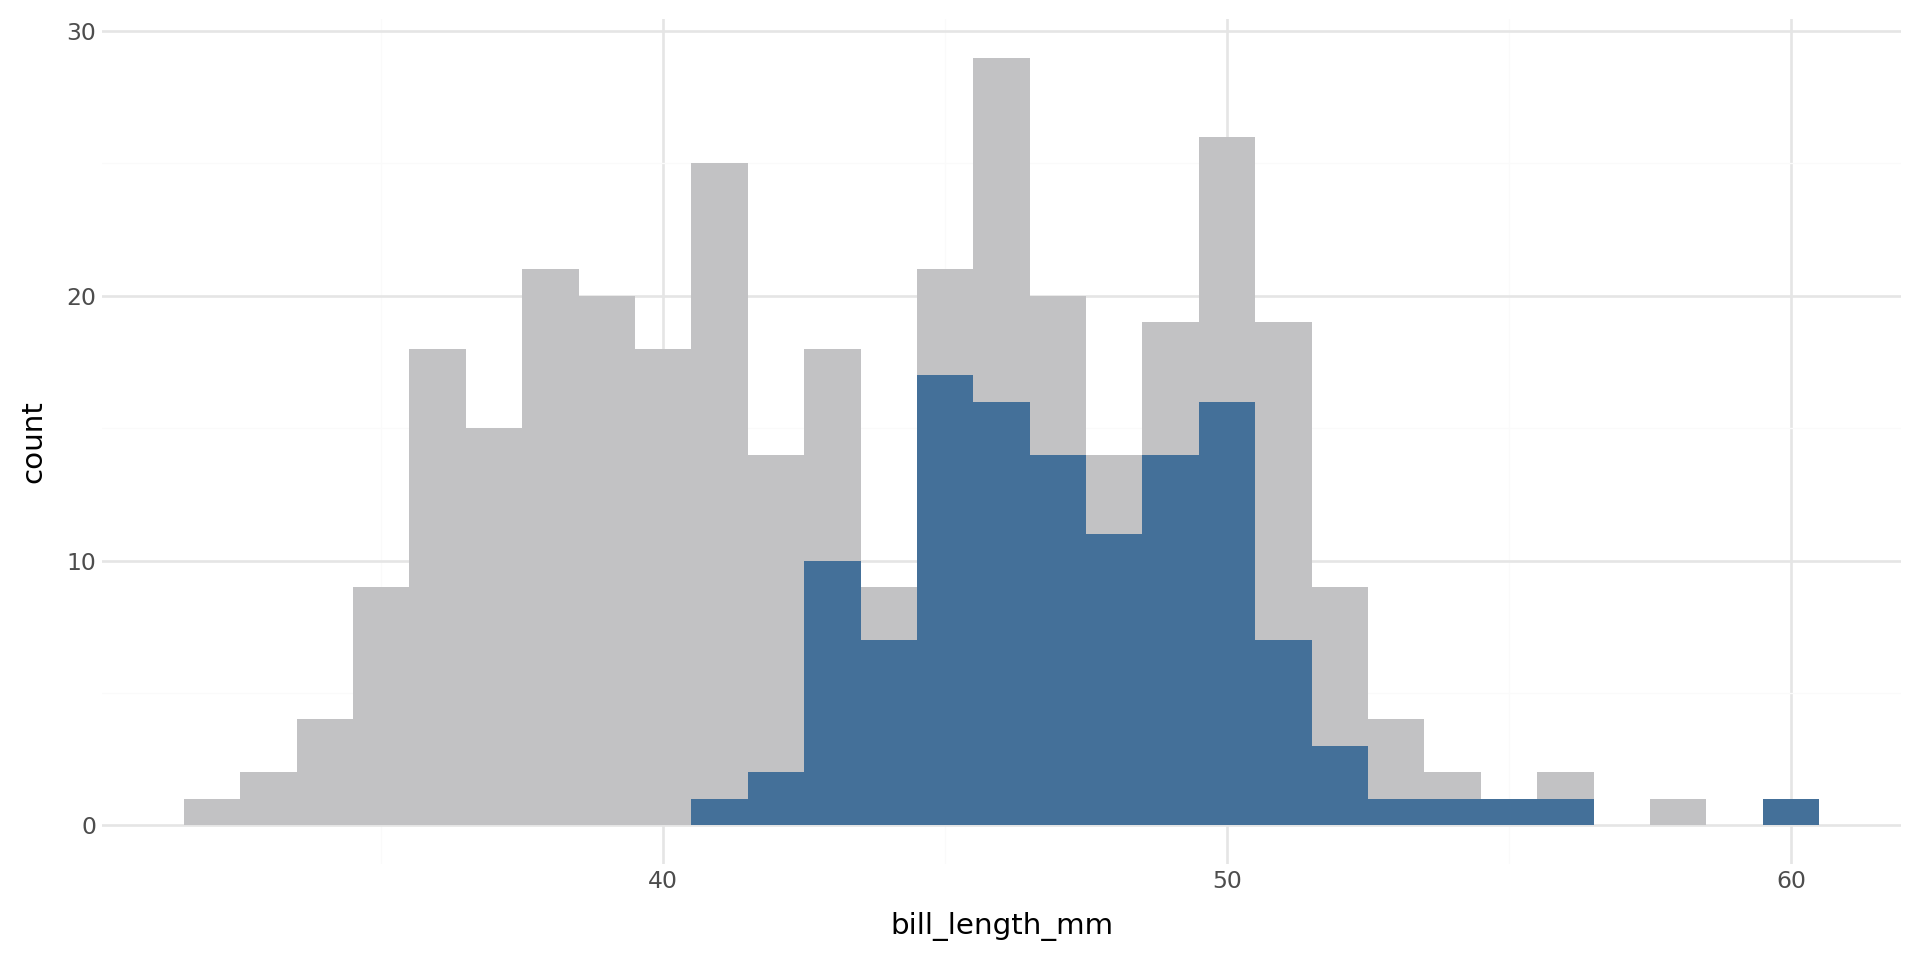
Change the species
from palmerpenguins import load_penguins
from plotnine import aes, geom_histogram, ggplot, theme_minimal

dat = load_penguins()
dat.head()

species = "Gentoo"  # change species
sel = dat.loc[dat.species == species]

(
    ggplot(aes(x="bill_length_mm"))
    + geom_histogram(dat, fill="#C2C2C4", binwidth=1)
    + geom_histogram(sel, fill="#447099", binwidth=1)
    + theme_minimal()
)
Change the species
Your Turn
- Create the working baseline code:
02:00
from palmerpenguins import load_penguins
from plotnine import aes, geom_histogram, ggplot, theme_minimal

dat = load_penguins()
dat.head()

species = "Gentoo"  # Adelie, Gentoo, Chinstrap
sel = dat.loc[dat.species == species]

(
    ggplot(aes(x="bill_length_mm"))
    + geom_histogram(dat, fill="#C2C2C4", binwidth=1)
    + geom_histogram(sel, fill="#447099", binwidth=1)
    + theme_minimal()
)
The user interface
Best try to mock up or wireframe a UI before starting
Input Components Gallery: https://shiny.posit.co/py/components/#inputs
What might be a good component to use?
01:00
Radio Buttons
#| '!! shinylive warning !!': |
#|   shinylive does not work in self-contained HTML documents.
#|   Please set `embed-resources: false` in your metadata.
# | standalone: true
# | components: [editor, viewer]
# | layout: horizontal
from shiny.express import ui

ui.input_radio_buttons(
    id="species",
    label="Species",
    choices=["Adelie", "Gentoo", "Chinstrap"],
)
Run your application
- Positron/VS Code + Shiny Extension
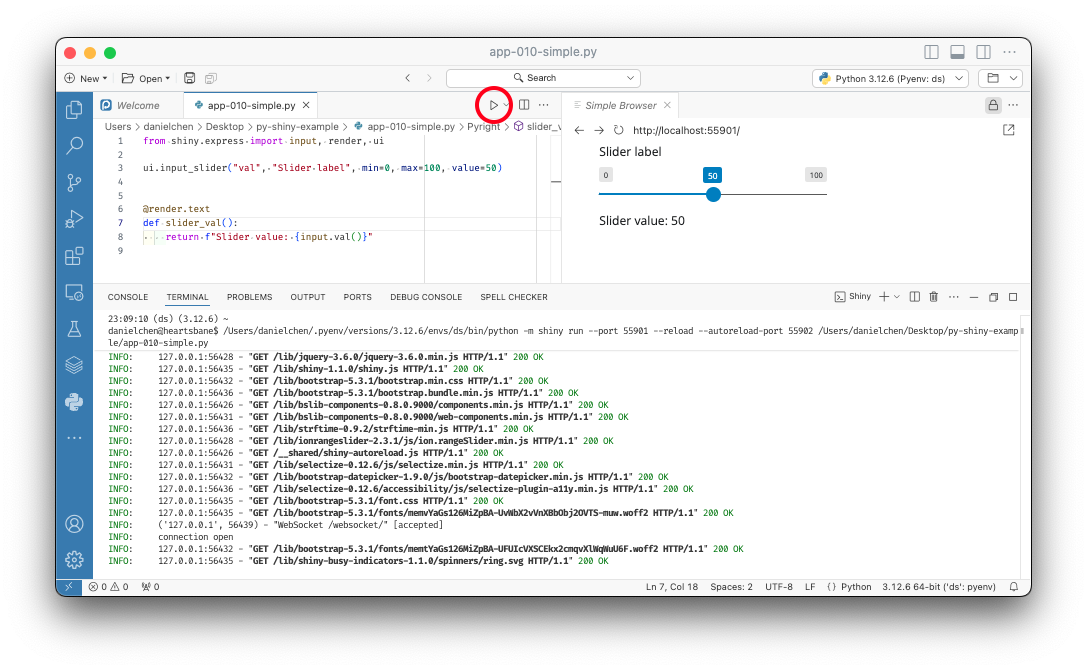
- Command line:
Radio Buttons: options
https://shiny.posit.co/py/api/express/express.ui.input_radio_buttons.html
#| '!! shinylive warning !!': |
#|   shinylive does not work in self-contained HTML documents.
#|   Please set `embed-resources: false` in your metadata.
# | standalone: true
# | components: [editor, viewer]
# | layout: horizontal
from shiny.express import ui

ui.input_radio_buttons(
    id="species",
    label="Species",
    choices=["Adelie", "Gentoo", "Chinstrap"],
    inline=True,
)02:00
Add in the figure
Now let’s add all that data and plotting code from earlier into our application.
If we just dump in our code, the application errors because it does not know what to do with the figure that’s trying to be printed.
Output will error
#| '!! shinylive warning !!': |
#|   shinylive does not work in self-contained HTML documents.
#|   Please set `embed-resources: false` in your metadata.
# | standalone: true
# | components: [editor, viewer]
# | layout: horizontal
from shiny.express import ui

from palmerpenguins import load_penguins
from plotnine import aes, geom_histogram, ggplot, theme_minimal

ui.input_radio_buttons(
    id="species",
    label="Species",
    choices=["Adelie", "Gentoo", "Chinstrap"],
    inline=True,
)

dat = load_penguins()
species = "Adelie"
sel = dat.loc[dat.species == species]

# this will cause a TypeError: Invalid tag item type
(
    ggplot(aes(x="bill_length_mm"))
    + geom_histogram(dat, fill="#C2C2C4", binwidth=1)
    + geom_histogram(sel, fill="#447099", binwidth=1)
    + theme_minimal()
)
Outputs
- Each output needs to be wrapped in it’s own function with the corresponding output decorator.
https://shiny.posit.co/py/components/#outputs
We now need to use one of the built-in Shiny output components,
Specifically, one that can render a
plotninefigure (which is based onmatplotlib), plot output component.For example, we want to return a plot, so we will need to wrap our plotnine code, and decorate it with the
@render.plotdecorator.
Render plot output
Return the output
Don’t forget to return the object you want displayed in the function! Otherwise the output will not render.
Render plot output
#| '!! shinylive warning !!': |
#| shinylive does not work in self-contained HTML documents.
#| Please set `embed-resources: false` in your metadata.
# | standalone: true
# | components: [editor, viewer]
# | layout: horizontal
from shiny.express import ui, render
from palmerpenguins import load_penguins
from plotnine import aes, geom_histogram, ggplot, theme_minimal
ui.input_radio_buttons(
id="species",
label="Species",
choices=["Adelie", "Gentoo", "Chinstrap"],
inline=True,
)
dat = load_penguins()
species = "Adelie"
sel = dat.loc[dat.species == species]
@render.plot #<<
def plot(): #<<
    return ( #<<
        ggplot(aes(x="bill_length_mm"))
        + geom_histogram(dat, fill="#C2C2C4", binwidth=1)
        + geom_histogram(sel, fill="#447099", binwidth=1)
        + theme_minimal()
)Reactivity
But the radio buttons don’t change anything
We didn’t connect the input component to the output component
Reactivity is what makes Shiny unique
The data reacts to the input
Your first application
#| '!! shinylive warning !!': |
#|   shinylive does not work in self-contained HTML documents.
#|   Please set `embed-resources: false` in your metadata.
#| standalone: true
#| components: [editor, viewer]
#| layout: horizontal
#| viewerHeight: 500

from palmerpenguins import load_penguins
from plotnine import aes, geom_histogram, ggplot, theme_minimal
from shiny.express import input, render, ui

dat = load_penguins()
species = dat["species"].unique().tolist()

ui.input_radio_buttons("species", "Species", species, inline=True)


@render.plot
def plot():
    sel = dat[dat["species"] == input.species()]
    return (
        ggplot(aes(x="bill_length_mm"))
        + geom_histogram(dat, fill="#C2C2C4", binwidth=1)
        + geom_histogram(sel, fill="#447099", binwidth=1)
        + theme_minimal()
)05:00
posit::conf(2025) https://github.com/posit-conf-2025/shiny-py