Dashboards
Slides
Exercises
Exercise 1
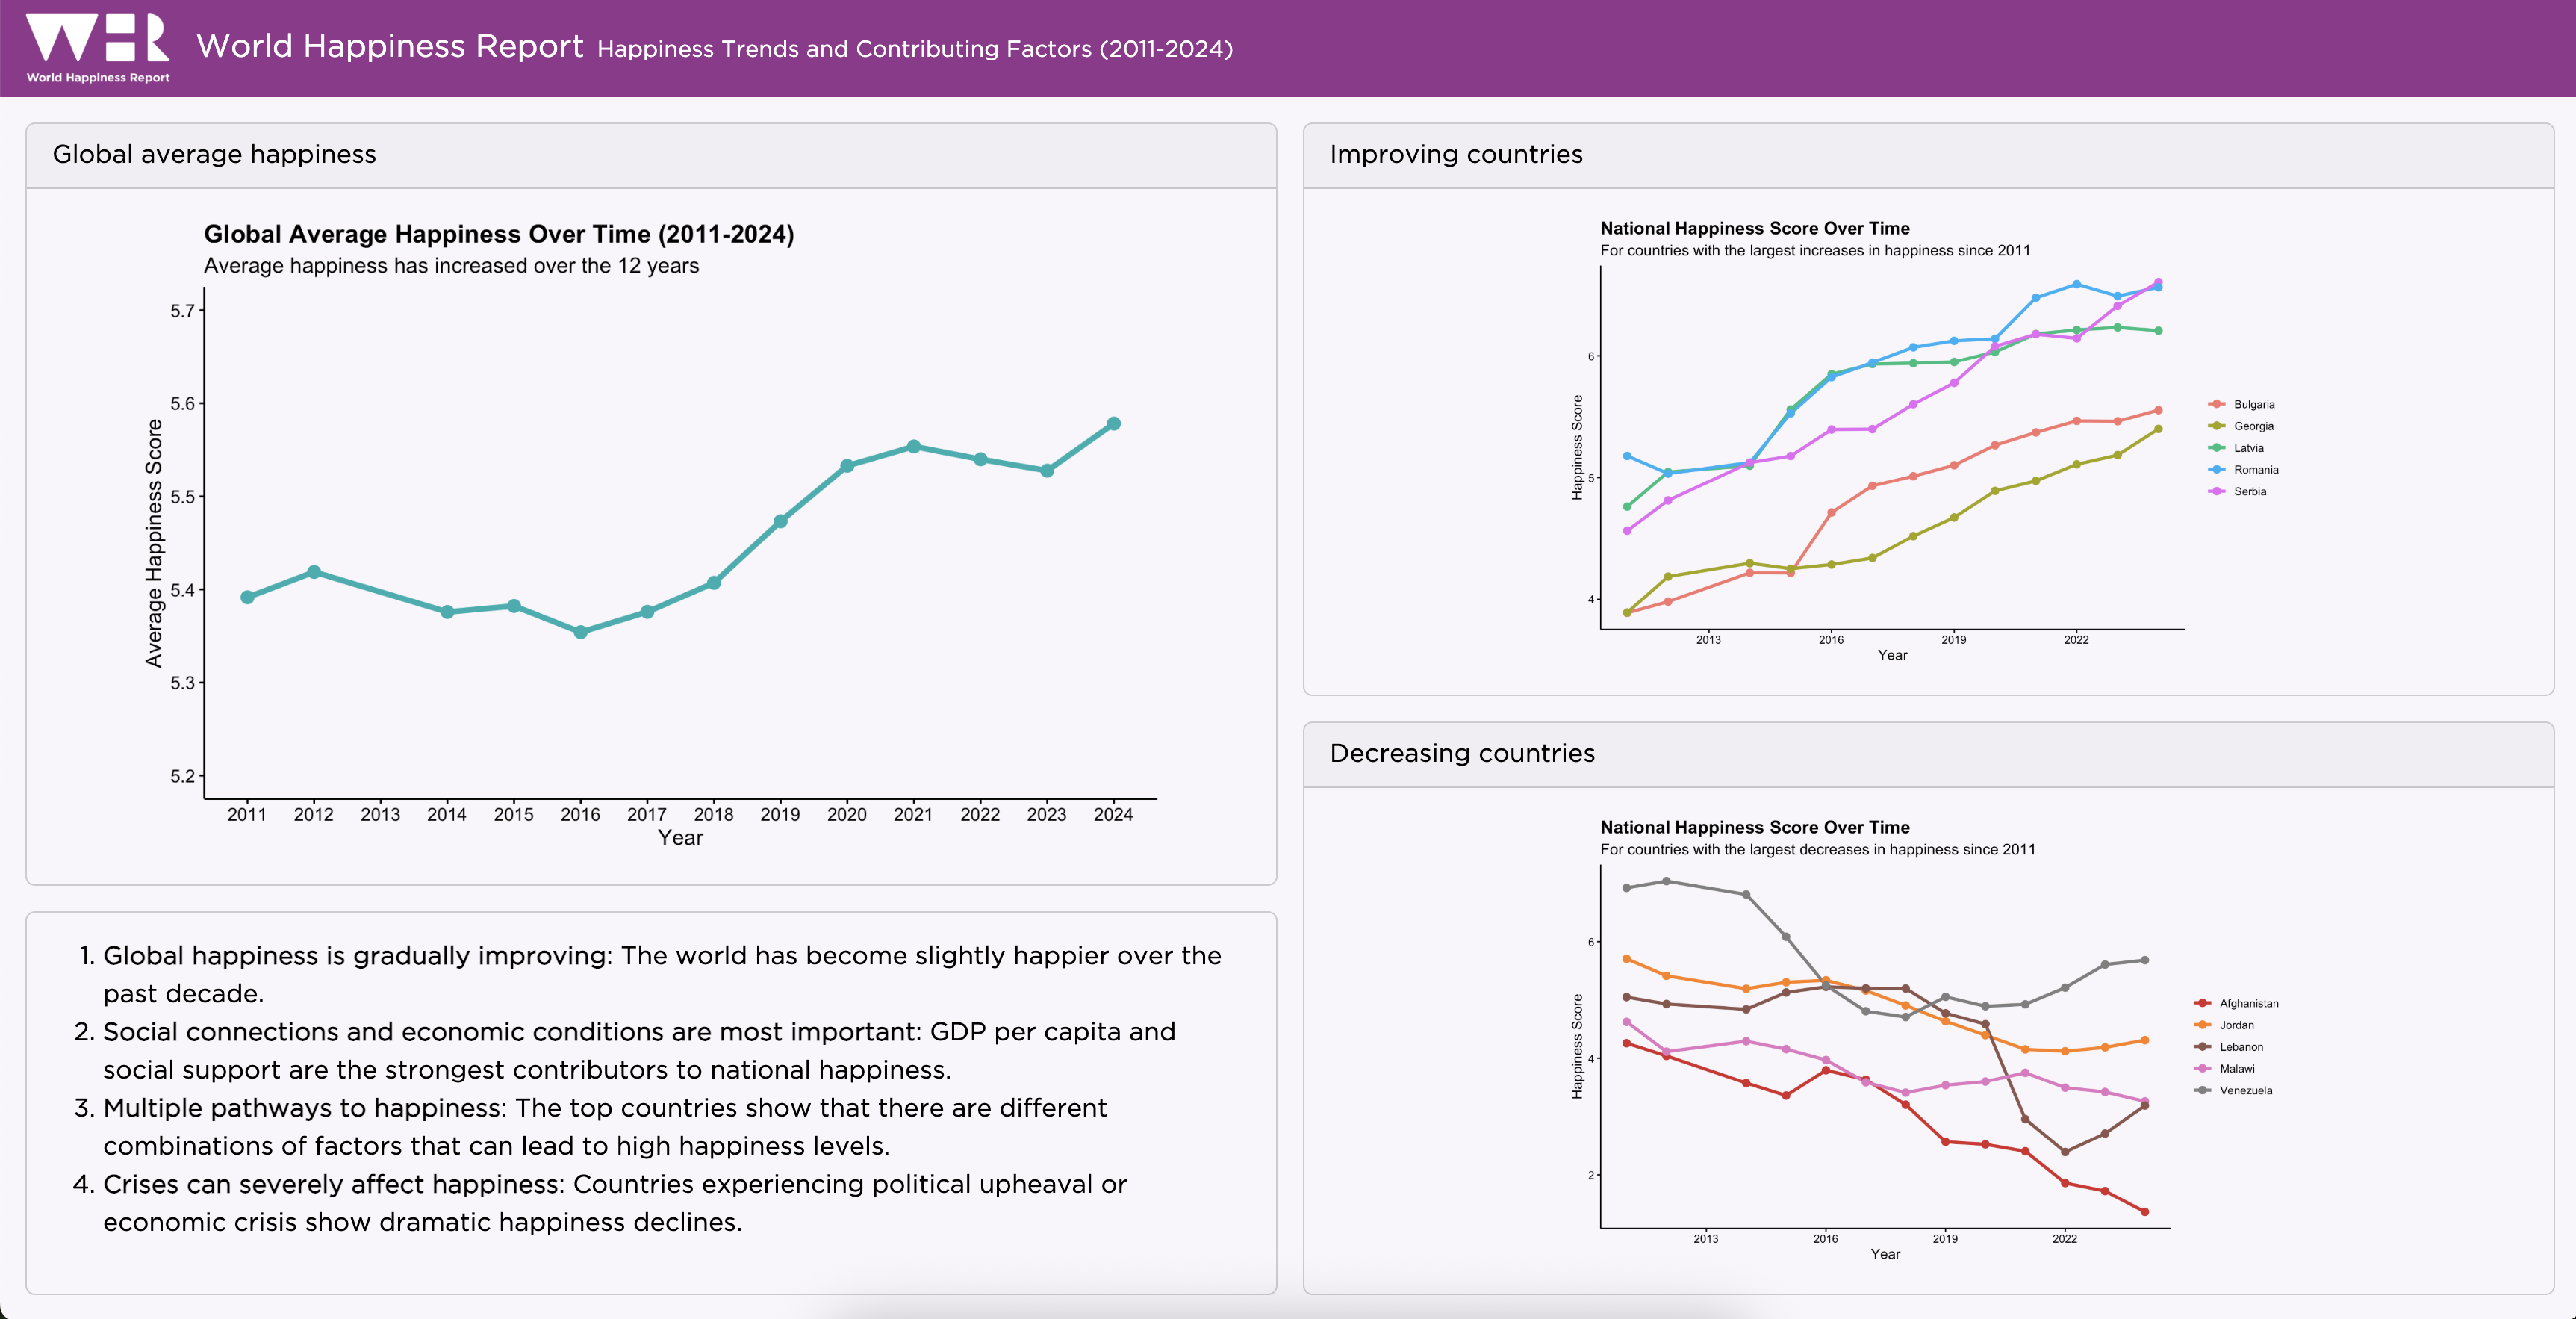
- Open
dashboard-r.qmdordashboard-python.qmd. - Change the format from
htmltodashboard. - Re-render.
- Add relevant titles to each card.
The brand.yml file should be automatically applied!
Exercise 2
Change the layout of your dashboard so that it looks like this:
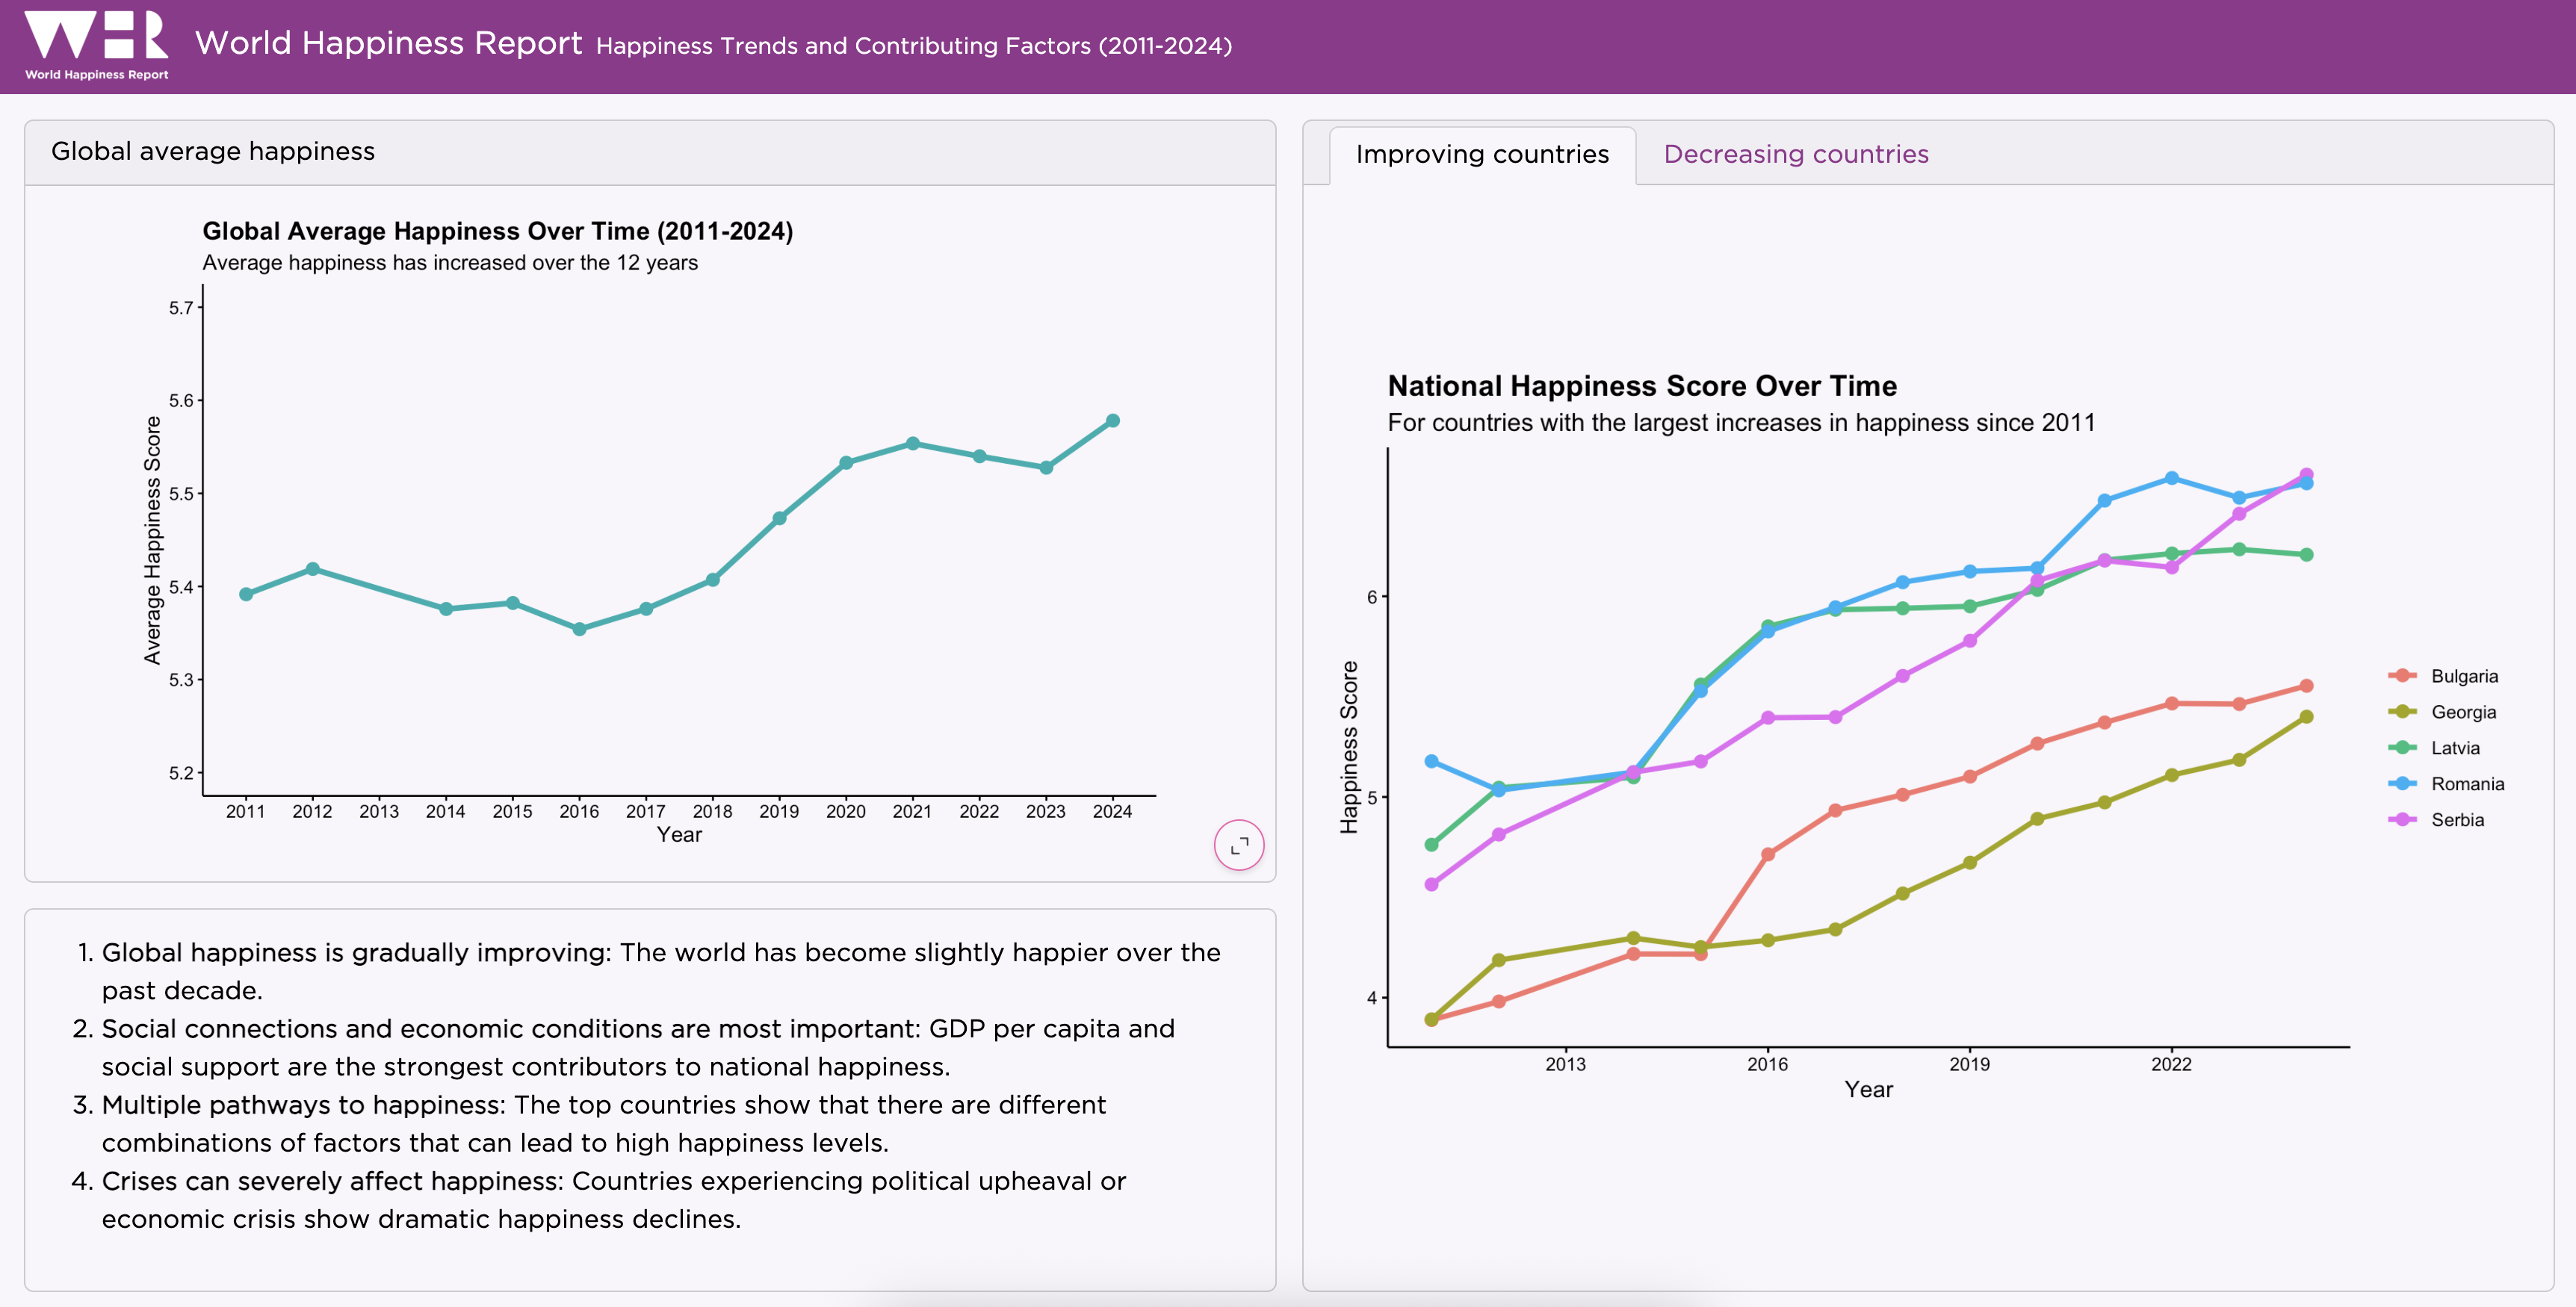
Exercise 3
Take a look at the Tabsets documentation on the Quarto website.
Move the plots showing the countries that increased and decreased in happiness into a tabset. Your dashboard should then look like this:
Exercise 4
Add two value boxes to your dashboard, above the tabset, so that your dashboard looks like this:
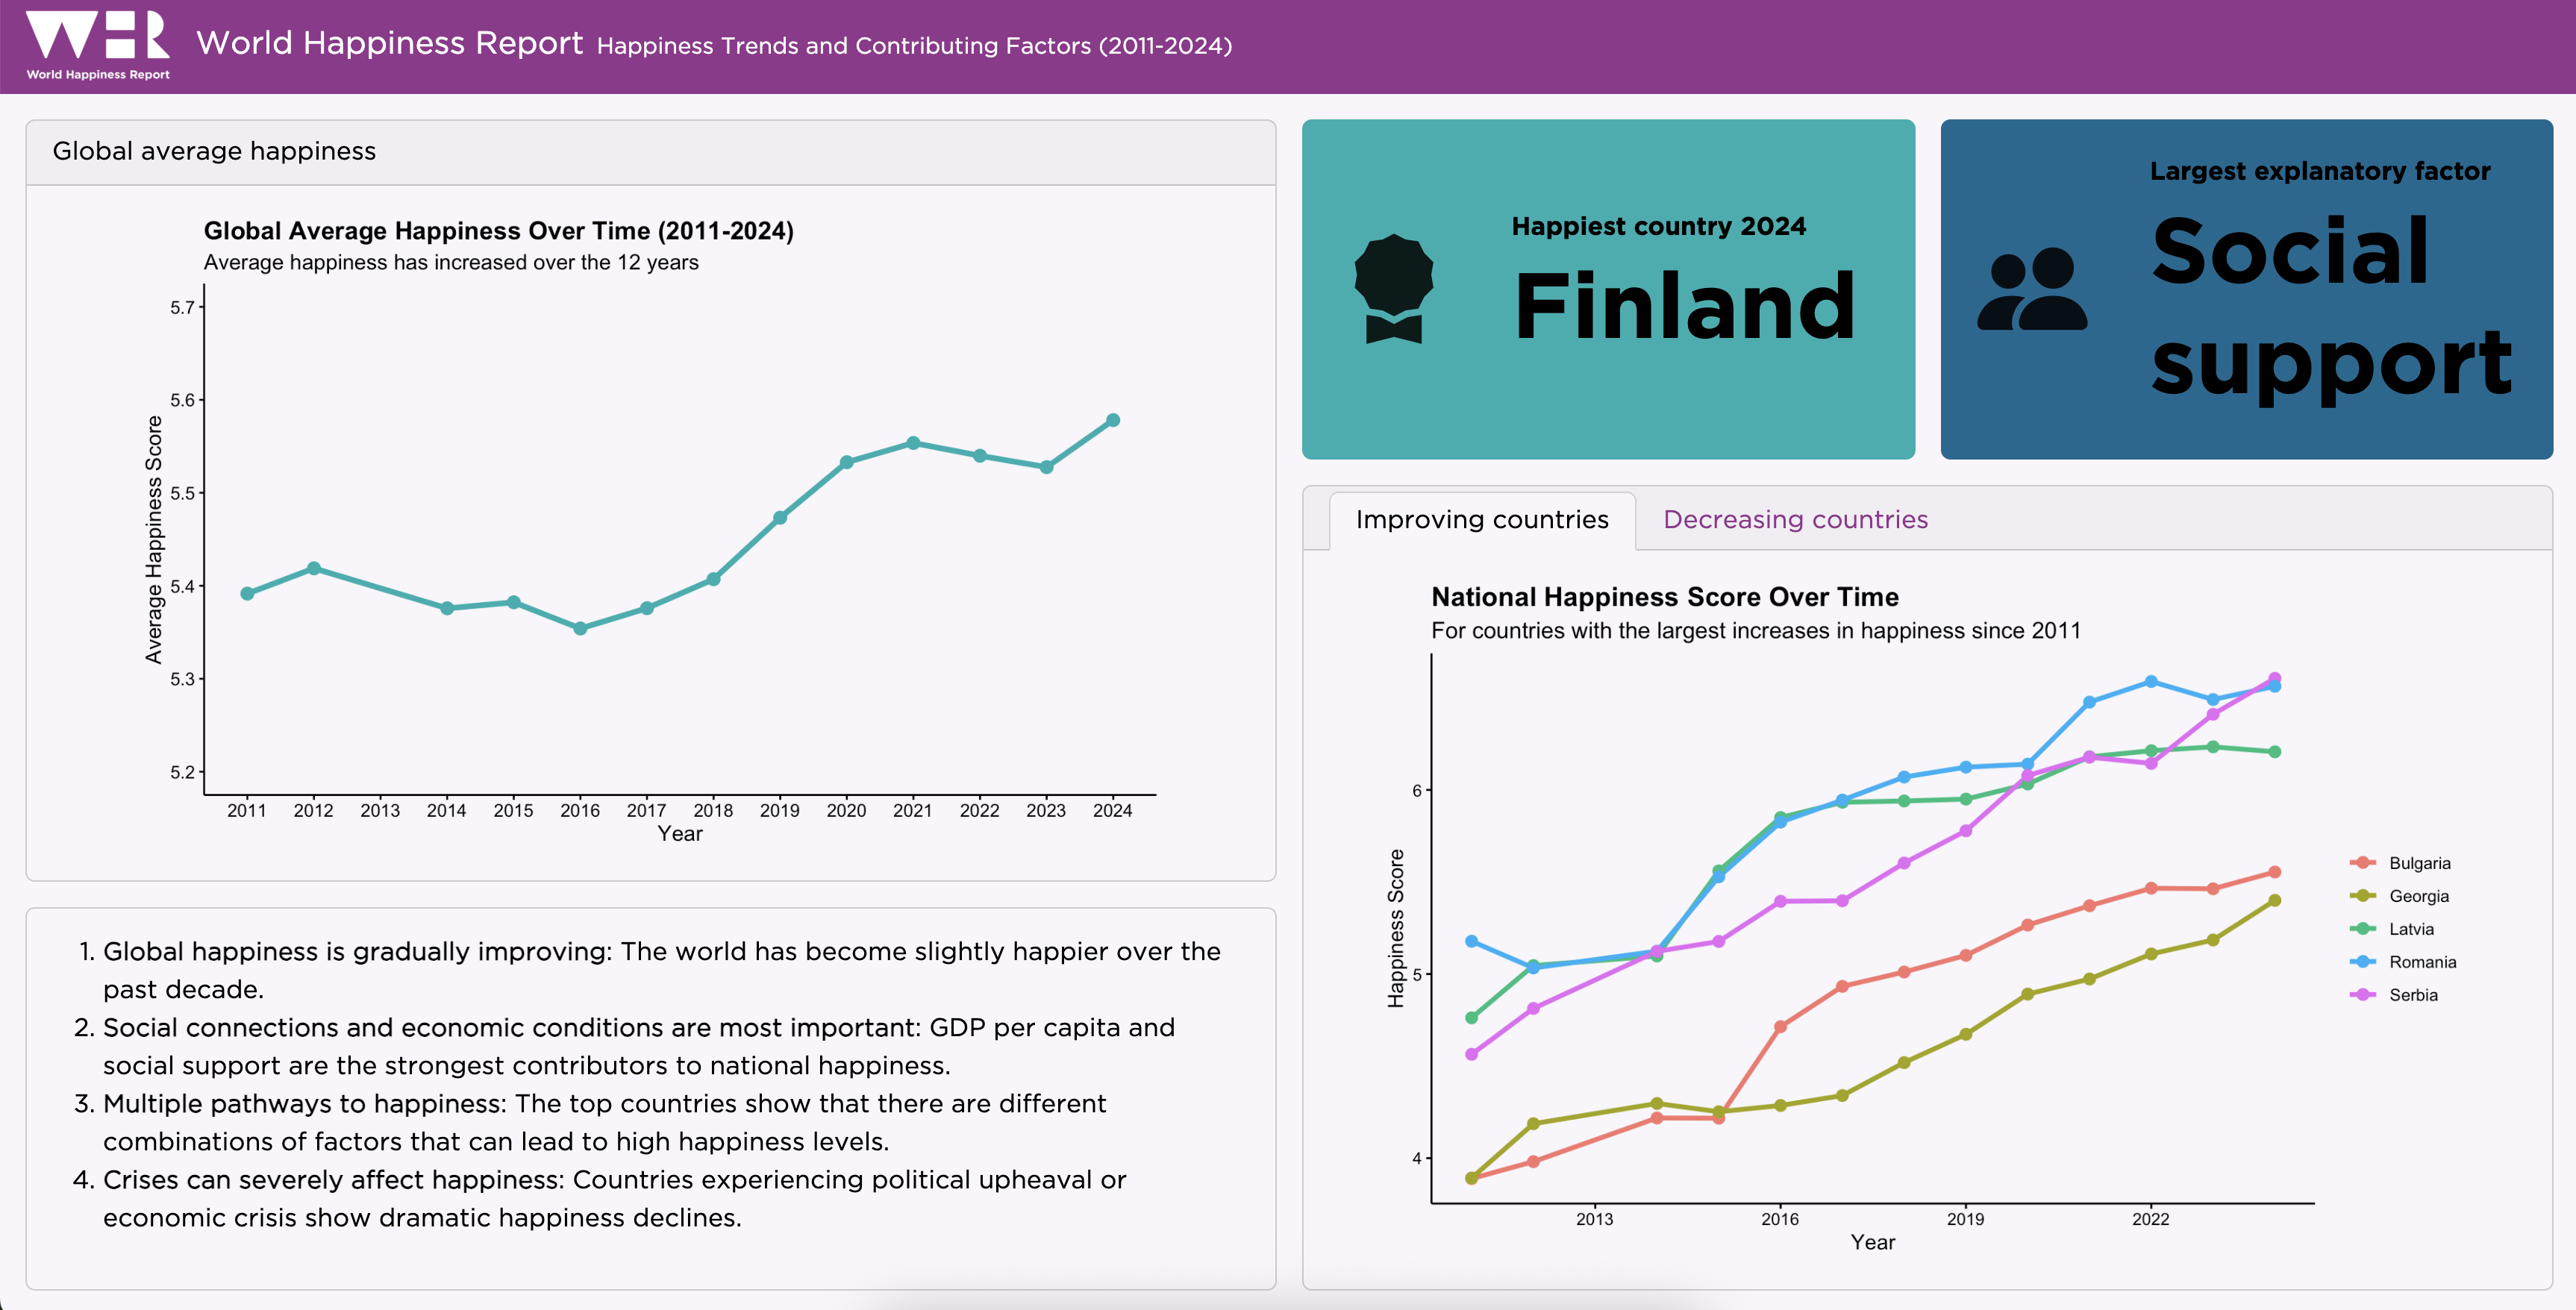
Use the brand colors. You can either hard-code the value box values (“Finland” and “Social support”) or calculate them using the data.